The article "SATX vs XTZ: Comparing Two Blockchain Platforms for Smart Contract Development" provides a comprehensive investment value analysis between SatoshiDEX (SATX) and Tezos (XTZ), focusing on aspects like price history, market status, tokenomics, and technical development. It answers critical investor questions such as "Which is the better buy?" and outlines investment strategies, risk factors, and future price predictions. Suitable for both new and experienced investors, it offers insights into the comparative advantages of SATX's DEX functionality and XTZ's smart contract platform. Key themes include market volatility, institutional adoption, and regulatory risks.
Introduction: SATX vs XTZ Investment Comparison
In the cryptocurrency market, the comparison between SatoshiDEX vs Tezos has always been an unavoidable topic for investors. The two not only show significant differences in market cap ranking, application scenarios, and price performance, but also represent different positioning in crypto assets.
SatoshiDEX (SATX): Since its launch, it has gained market recognition for its role as a decentralized exchange (DEX) built on the Stacks blockchain.
Tezos (XTZ): Since its inception in 2017, it has been hailed as a self-amending blockchain and smart contract platform, making it one of the cryptocurrencies with significant global trading volume and market capitalization.
This article will comprehensively analyze the investment value comparison between SATX and XTZ, focusing on historical price trends, supply mechanisms, institutional adoption, technological ecosystems, and future predictions, attempting to answer the question most concerning to investors:
"Which is the better buy right now?"
I. Price History Comparison and Current Market Status
SatoshiDEX (SATX) and Tezos (XTZ) Historical Price Trends
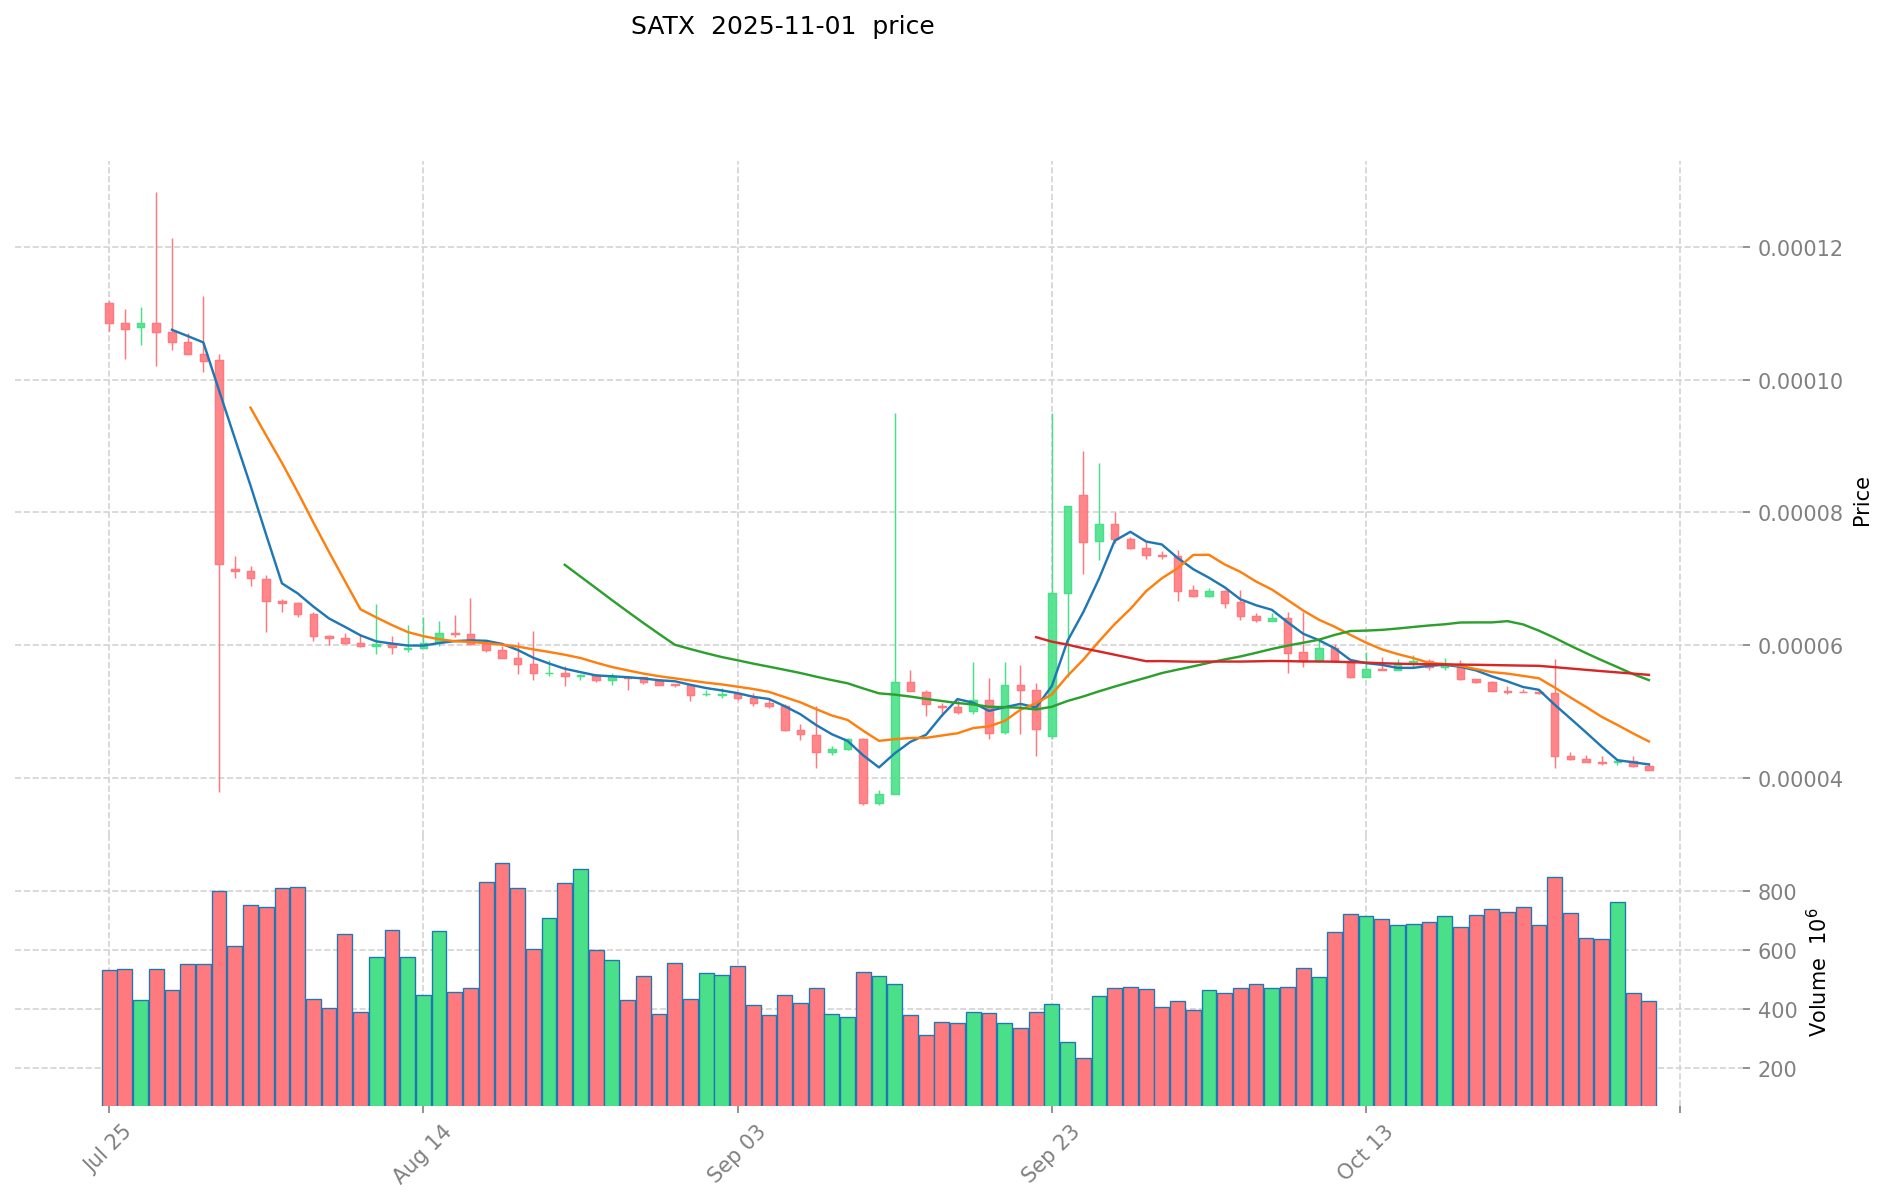
- 2024: SATX reached its all-time high of $0.0274 on November 7, 2024.
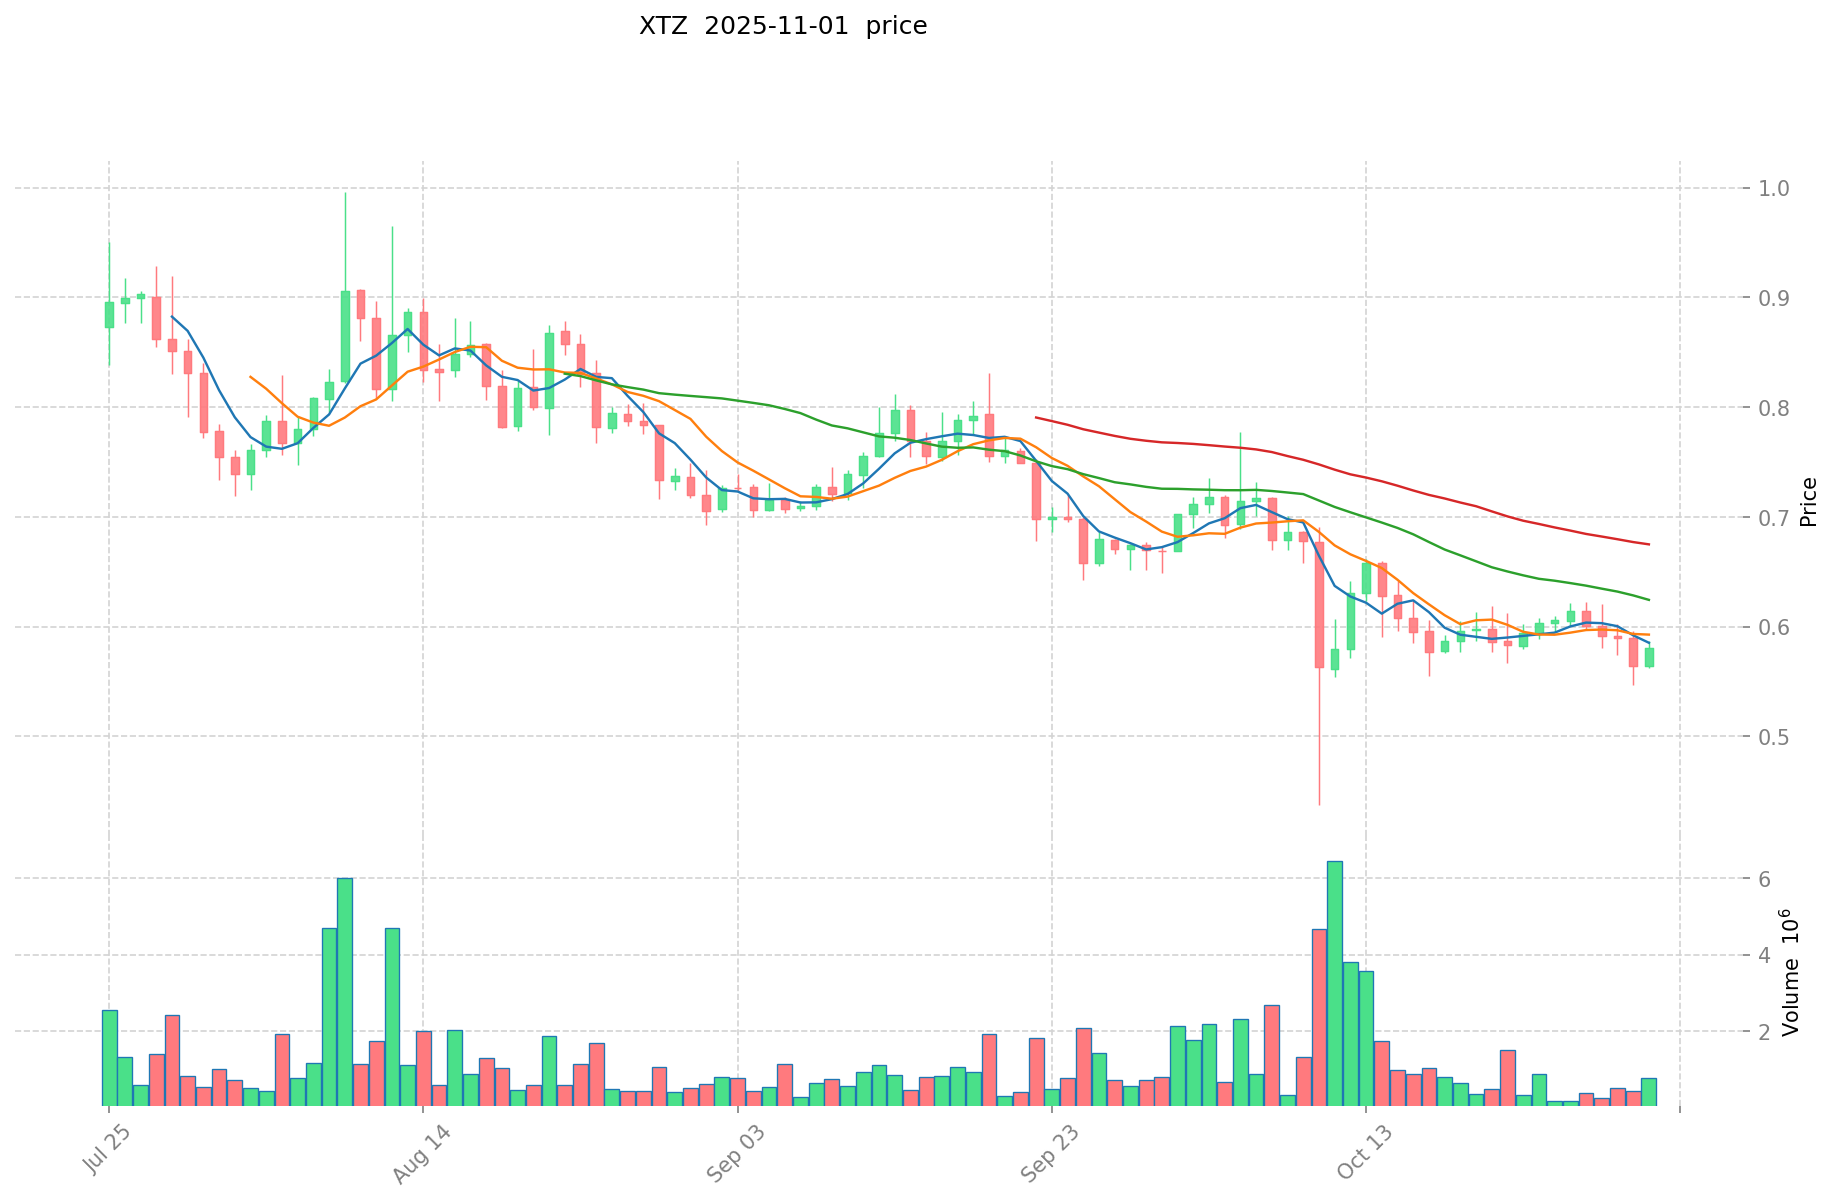
- 2021: XTZ reached its all-time high of $9.12 on October 4, 2021, driven by increased adoption and market optimism.
- Comparative analysis: During the recent market cycle, SATX dropped from its high of $0.0274 to a low of $0.00003588, while XTZ declined from $9.12 to its current level, showing significant volatility in both assets.
Current Market Situation (2025-11-01)
- SATX current price: $0.00003996
- XTZ current price: $0.5838
- 24-hour trading volume: SATX $21,966.77 vs XTZ $353,682.42
- Market Sentiment Index (Fear & Greed Index): 33 (Fear)
Click to view real-time prices:
- View SATX current price Market Price
- View XTZ current price Market Price
II. Core Factors Affecting SATX vs XTZ Investment Value
Supply Mechanism Comparison (Tokenomics)
- SATX: Limited information available on supply mechanism
- XTZ: Limited information available on supply mechanism
- 📌 Historical Pattern: Insufficient data on how supply mechanisms drive price cycle changes.
Institutional Adoption and Market Applications
- Institutional Holdings: Insufficient data on institutional preference
- Enterprise Adoption: Limited information on cross-border payment, settlement, and portfolio applications
- National Policies: Information on regulatory attitudes across different countries is not available
Technical Development and Ecosystem Building
- SATX Technical Upgrades: Insufficient information available
- XTZ Technical Development: Collaboration with Swedish Dirac to develop a digital streaming system for computer users
- Ecosystem Comparison: Limited data on DeFi, NFT, payment, and smart contract implementation
Macroeconomic and Market Cycles
- Performance in Inflationary Environment: Insufficient data on anti-inflation properties
- Macroeconomic Monetary Policy: Limited information on how interest rates and the US Dollar Index affect both assets
- Geopolitical Factors: No clear information on cross-border transaction demands or international situations
III. 2025-2030 Price Prediction: SATX vs XTZ
Short-term Prediction (2025)
- SATX: Conservative $0.0000314183 - $0.00003977 | Optimistic $0.00003977 - $0.0000453378
- XTZ: Conservative $0.472392 - $0.5832 | Optimistic $0.5832 - $0.868968
Mid-term Prediction (2027)
- SATX may enter a growth phase, with expected prices ranging from $0.000025598298545 to $0.00005409451768
- XTZ may enter a bullish market, with expected prices ranging from $0.8121975624 to $1.0714095504
- Key drivers: Institutional capital inflow, ETF, ecosystem development
Long-term Prediction (2030)
- SATX: Base scenario $0.000054981305529 - $0.000061090339477 | Optimistic scenario $0.000061090339477 - $0.000071475697188
- XTZ: Base scenario $0.901554639613689 - $1.17085018131648 | Optimistic scenario $1.17085018131648 - $1.592356246590412
View detailed price predictions for SATX and XTZ
Disclaimer: This analysis is based on historical data and market projections. Cryptocurrency markets are highly volatile and unpredictable. This information should not be considered as financial advice. Always conduct your own research before making investment decisions.
SATX:
| 年份 |
预测最高价 |
预测平均价格 |
预测最低价 |
涨跌幅 |
| 2025 |
0.0000453378 |
0.00003977 |
0.0000314183 |
0 |
| 2026 |
0.000054043453 |
0.0000425539 |
0.000028936652 |
6 |
| 2027 |
0.00005409451768 |
0.0000482986765 |
0.000025598298545 |
20 |
| 2028 |
0.000062459848449 |
0.00005119659709 |
0.000030205992283 |
28 |
| 2029 |
0.000065352456185 |
0.000056828222769 |
0.000033528651434 |
42 |
| 2030 |
0.000071475697188 |
0.000061090339477 |
0.000054981305529 |
52 |
XTZ:
| 年份 |
预测最高价 |
预测平均价格 |
预测最低价 |
涨跌幅 |
| 2025 |
0.868968 |
0.5832 |
0.472392 |
0 |
| 2026 |
1.00199592 |
0.726084 |
0.52278048 |
24 |
| 2027 |
1.0714095504 |
0.86403996 |
0.8121975624 |
48 |
| 2028 |
1.141915211136 |
0.9677247552 |
0.570957605568 |
65 |
| 2029 |
1.28688037946496 |
1.054819983168 |
0.62234379006912 |
80 |
| 2030 |
1.592356246590412 |
1.17085018131648 |
0.901554639613689 |
100 |
IV. Investment Strategy Comparison: SATX vs XTZ
Long-term vs Short-term Investment Strategy
- SATX: Suitable for investors focused on DEX potential and Stacks ecosystem growth
- XTZ: Suitable for investors interested in self-amending blockchain technology and smart contract platforms
Risk Management and Asset Allocation
- Conservative investors: SATX 20% vs XTZ 80%
- Aggressive investors: SATX 40% vs XTZ 60%
- Hedging tools: Stablecoin allocation, options, cross-currency portfolios
V. Potential Risk Comparison
Market Risk
- SATX: High volatility due to lower market cap and trading volume
- XTZ: Subject to broader crypto market trends and sentiment
Technical Risk
- SATX: Scalability, network stability on Stacks blockchain
- XTZ: Potential vulnerabilities in self-amending mechanism, smart contract security
Regulatory Risk
- Global regulatory policies may impact both assets differently, with potential for increased scrutiny on DEXs affecting SATX
VI. Conclusion: Which Is the Better Buy?
📌 Investment Value Summary:
- SATX advantages: DEX functionality, potential for growth within Stacks ecosystem
- XTZ advantages: Established market presence, self-amending blockchain technology, smart contract capabilities
✅ Investment Advice:
- New investors: Consider a small allocation to XTZ for exposure to established blockchain platforms
- Experienced investors: Balanced approach with both SATX and XTZ, leveraging DEX potential and smart contract capabilities
- Institutional investors: Focus on XTZ for its larger market cap and established ecosystem, with potential small allocation to SATX for diversification
⚠️ Risk Warning: Cryptocurrency markets are highly volatile. This article does not constitute investment advice.
None
VII. FAQ
Q1: What are the key differences between SATX and XTZ?
A: SATX is a decentralized exchange (DEX) token built on the Stacks blockchain, while XTZ is the native token of Tezos, a self-amending blockchain and smart contract platform. SATX focuses on DEX functionality, while XTZ offers broader blockchain infrastructure capabilities.
Q2: Which has performed better historically, SATX or XTZ?
A: XTZ has a longer price history and reached a higher all-time high of $9.12 in October 2021. SATX's all-time high was $0.0274 in November 2024. However, both have experienced significant volatility and price declines from their peak values.
Q3: How do the current market situations of SATX and XTZ compare?
A: As of November 1, 2025, SATX is priced at $0.00003996 with a 24-hour trading volume of $21,966.77, while XTZ is priced at $0.5838 with a 24-hour trading volume of $353,682.42. XTZ has a significantly higher trading volume and price.
Q4: What are the primary factors affecting the investment value of SATX and XTZ?
A: Key factors include supply mechanisms, institutional adoption, technical development, ecosystem building, and macroeconomic conditions. However, detailed information on some of these factors is limited for both assets.
Q5: What are the long-term price predictions for SATX and XTZ?
A: By 2030, SATX is predicted to range from $0.000054981305529 to $0.000071475697188, while XTZ is expected to range from $0.901554639613689 to $1.592356246590412 in optimistic scenarios. These predictions are subject to market volatility and should not be considered financial advice.
Q6: How should investors allocate their assets between SATX and XTZ?
A: Conservative investors might consider allocating 20% to SATX and 80% to XTZ, while more aggressive investors could opt for a 40% SATX and 60% XTZ split. However, individual allocations should be based on personal risk tolerance and investment goals.
Q7: What are the main risks associated with investing in SATX and XTZ?
A: Both assets face market risks due to crypto volatility. SATX may have higher volatility due to its lower market cap. Technical risks include scalability for SATX and potential vulnerabilities in XTZ's self-amending mechanism. Regulatory risks could impact both, with potential increased scrutiny on DEXs affecting SATX more directly.
* The information is not intended to be and does not constitute financial advice or any other recommendation of any sort offered or endorsed by Gate.


