#GateSquarePizzaDay
#BTC
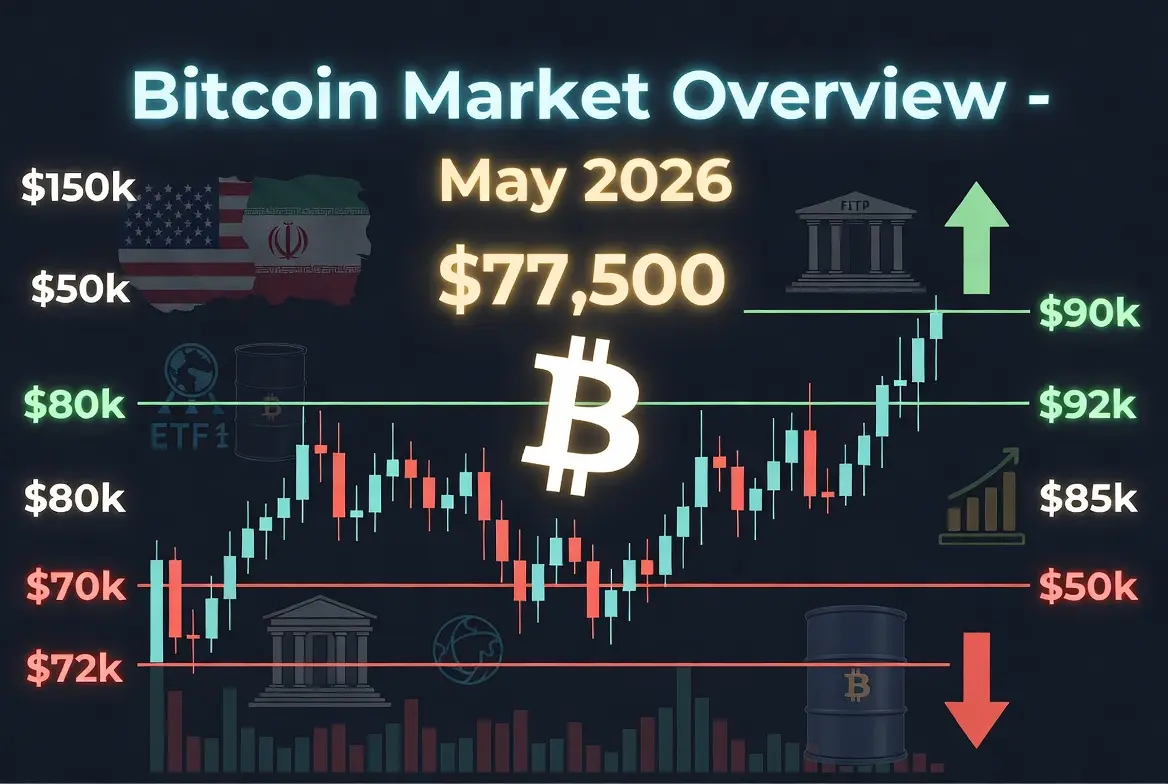
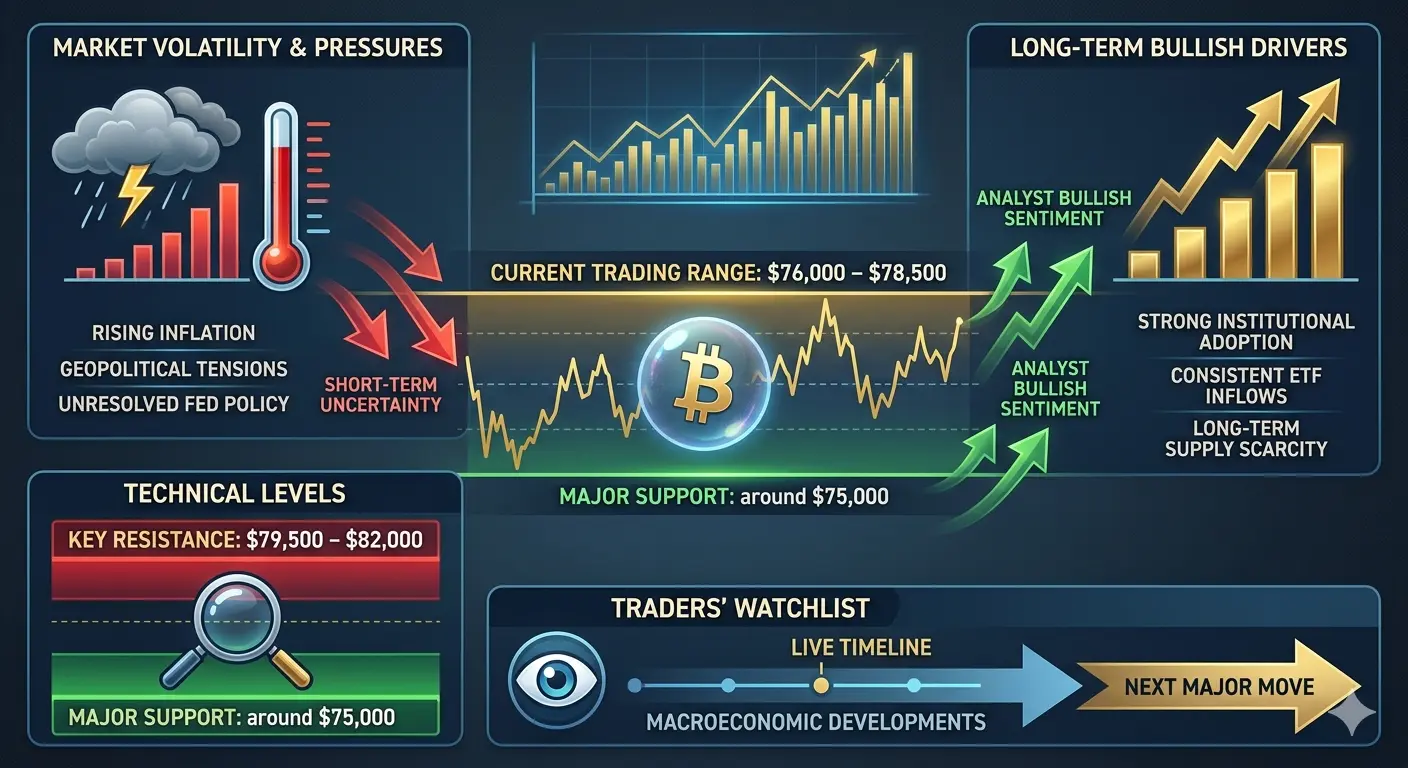
Bitcoin is currently trading around $77,000–$78,000, holding a relatively stable structure after months of high volatility and macro-driven swings. The asset has formed a clear consolidation range between $76,000 and $80,000, reflecting equilibrium between buyers accumulating at lower levels and sellers defending higher resistance zones.
The $80,000 level remains a critical psychological and technical barrier. A decisive breakout above this zone could signal renewed bullish expansion, while failure to reclaim it may extend the ongoing consolidation phase. On the downside, Bitcoin continues to maintain structural strength above the $72,000–$74,000 support zone, which has repeatedly acted as a demand area during recent corrections.
Despite this stabilization, BTC still trades significantly below its all-time high near $126,000 (October 2025), highlighting that the broader cycle has transitioned from expansion into distribution and consolidation.
Price Forecast and Technical Analysis
Key Support and Resistance Structure
Bitcoin’s technical landscape is currently well-defined:
Immediate Support: $72,000–$74,000
Major Structural Support: $70,000–$72,000 (aligned with 200-week EMA)
Critical Breakdown Zone: Below $70,000 opens risk toward $60,000–$62,000
Primary Resistance: $80,000
Extended Resistance: $85,000–$88,000
Macro Resistance Zone: $92,000–$95,000
The 200-week exponential moving average continues to act as a historically significant cycle indicator, often marking long-term accumulation zones during deep corrections.
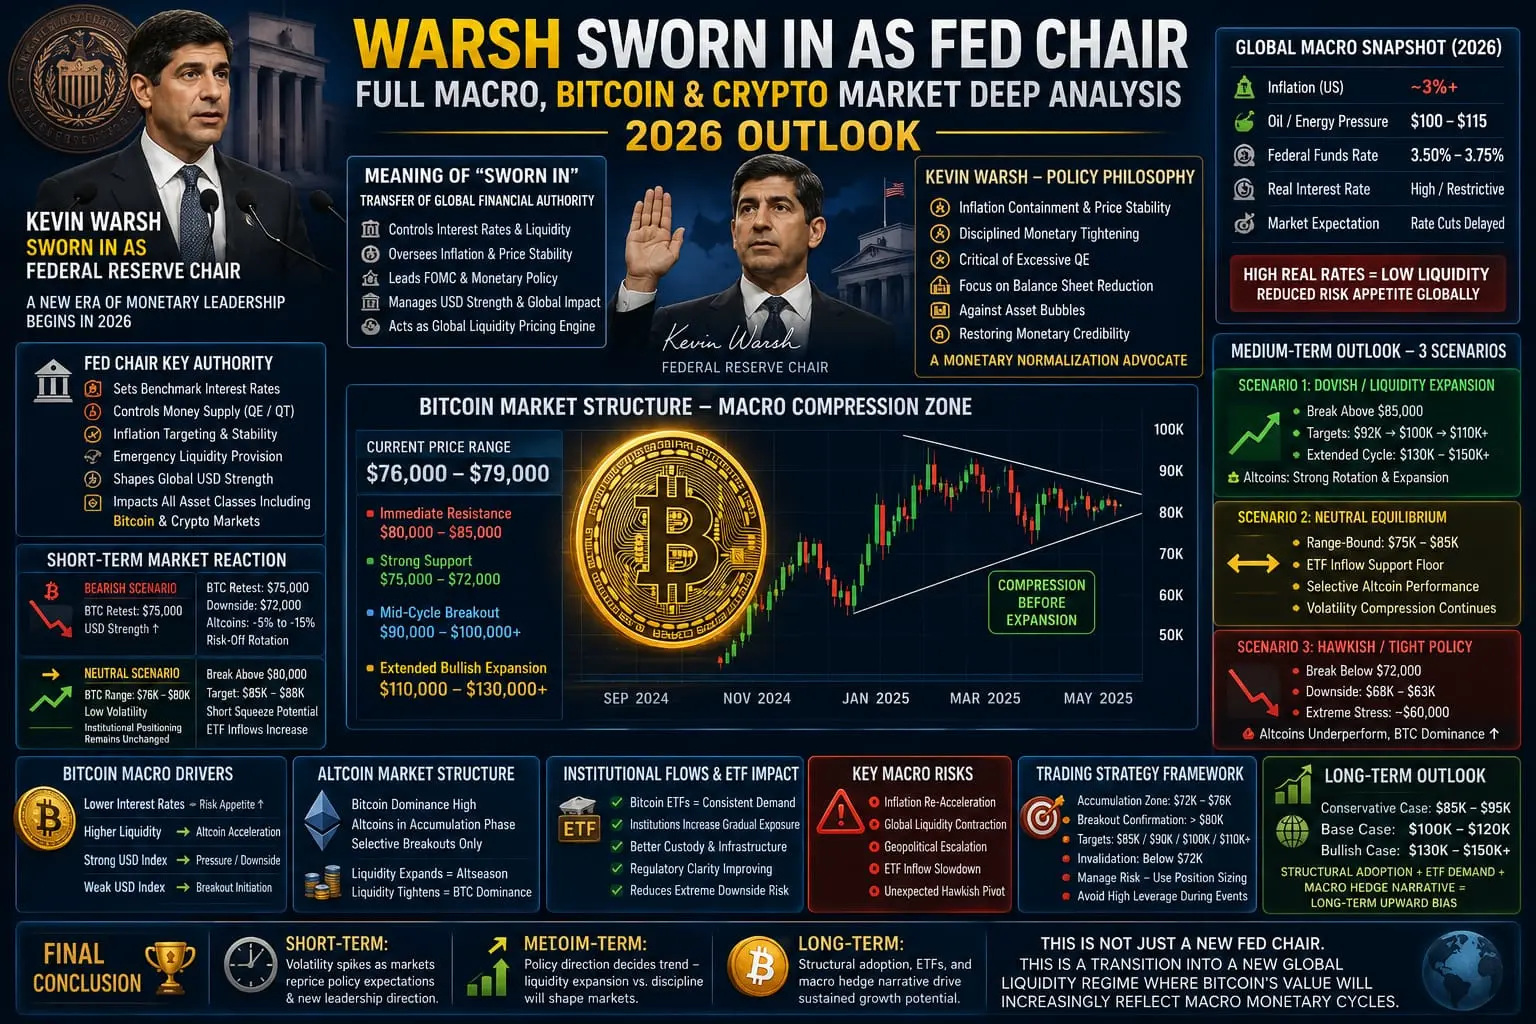
Bullish Scenario
A sustained breakout above $80,000 would likely trigger momentum-driven continuation toward $85,000 initially, followed by extended targets in the $92,000–$95,000 region. If macro liquidity conditions improve and institutional inflows strengthen, Bitcoin could revisit broader upside projections toward $100,000+ levels, with some long-cycle models extending toward $150,000–$250,000 based on adoption-driven valuation expansion.
ETF-related demand and long-term accumulation behavior remain key drivers behind this bullish structure.
Bearish Scenario
If Bitcoin fails to hold $72,000 support, downside pressure could accelerate toward $70,000, followed by deeper retracement zones at $60,000–$62,000. In a more severe macro contraction scenario, analysts highlight a potential long-term cycle floor in the $45,000–$50,000 range, based on historical correction patterns of 40–50% following major cycle peaks.
Such a move would typically coincide with risk-off liquidity conditions and sustained monetary tightening.
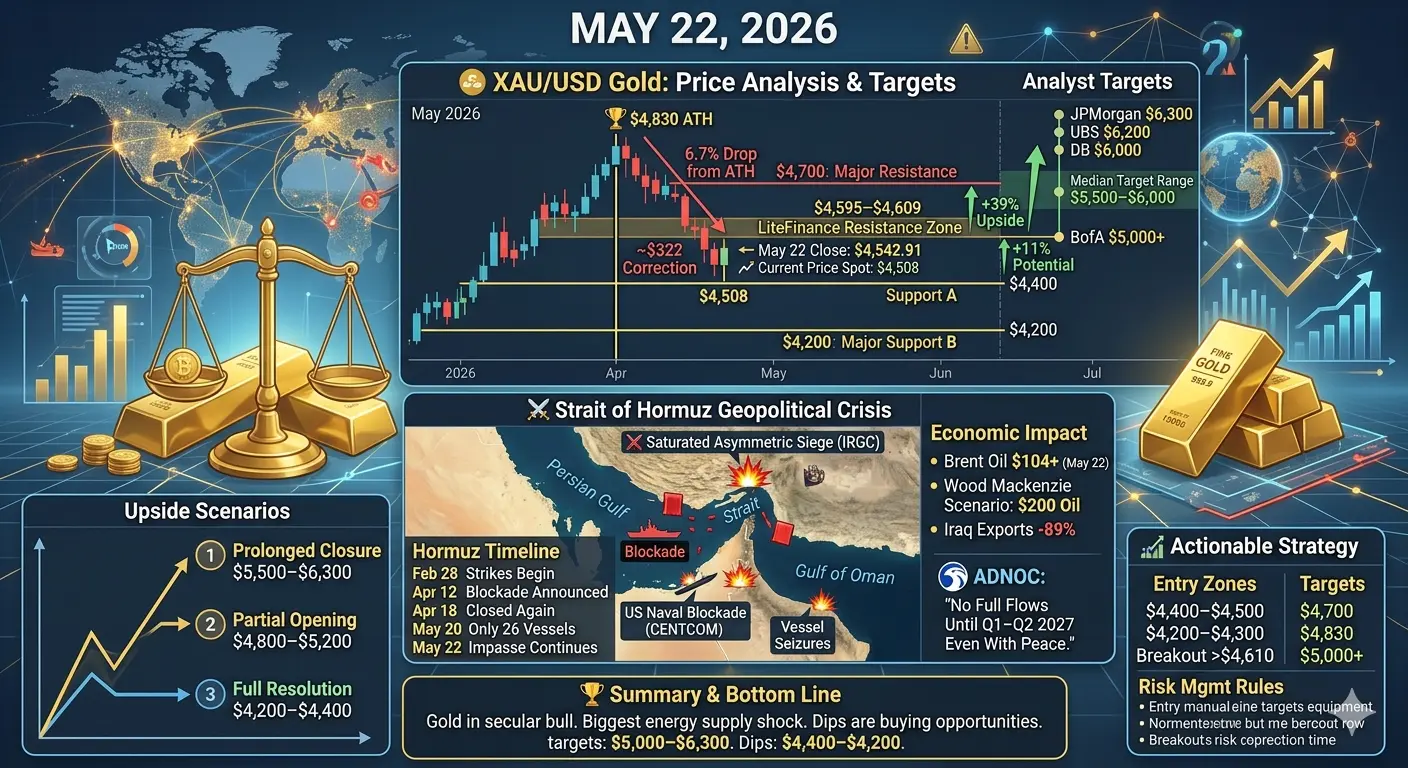
Geopolitical Impact on Bitcoin (US–Iran Tensions)
Global geopolitical uncertainty, particularly US–Iran tensions, has added volatility to risk assets. During the initial escalation phase, Bitcoin briefly declined toward $63,000, reflecting panic-driven liquidation and risk-off positioning across global markets.
However, the recovery back above $75,000 demonstrates strong underlying demand and resilience, suggesting that institutional and long-term holders are absorbing sell pressure rather than exiting positions aggressively.
Historically, Bitcoin has shown mixed but often temporary reactions to geopolitical shocks, with price action stabilizing once initial uncertainty fades.
Oil Prices and Inflation Link
Oil prices above $100 per barrel have intensified inflation concerns globally. A key macro relationship suggests that every $10 increase in crude oil can add approximately 0.20% to CPI inflation, directly influencing Federal Reserve policy expectations.
If geopolitical tensions persist and energy prices remain elevated, inflation could remain sticky, forcing central banks to maintain restrictive monetary policy for longer. This scenario typically reduces liquidity availability for risk-on assets like Bitcoin.
CPI Data and Federal Reserve Policy Outlook
Inflation Environment
Recent macro data indicates persistent inflation pressure:
CPI: 3.8% YoY
Core CPI: 2.8%
PPI: Strong monthly surge indicating cost-side inflation persistence
Meanwhile, U.S. Treasury yields have risen sharply, with the 10-year note reaching 4.59%, reflecting tighter financial conditions across markets.
Interest Rate Expectations
Market expectations for near-term rate cuts have significantly declined. A June cut is now nearly off the table, with expectations pushed toward late Q3 or Q4 2026.
Some macro analysts even suggest the possibility of additional rate hikes if inflation remains elevated. This environment is typically unfavorable for Bitcoin in the short term, as higher yields increase the opportunity cost of holding non-yielding assets.
Institutional Positioning and Market Sentiment
Options Market Behavior
The derivatives market reflects a cautious institutional stance. While there is strong call interest around the $80,000 strike, indicating upside speculation, there is also consistent demand for protective puts.
This dual positioning highlights a hedged institutional environment, where participants remain exposed to upside but actively protect against downside risk. The overall structure suggests neutral-to-cautious sentiment rather than aggressive bullish conviction.
ETF Flow Dynamics
Bitcoin ETF flows have shown early stabilization after prior periods of net outflows. However, inflows remain inconsistent, reflecting hesitation among large investors due to macro uncertainty and geopolitical risk.
Despite this, the stabilization itself is an important signal that large-scale distribution pressure may be easing.
Trading Strategy Recommendations
Short-Term Traders
Short-term traders should focus on clearly defined levels:
Buy zone: $72,000–$74,000
Breakout trigger: Above $80,000
Risk management: Tight stops below local swing lows
Due to macro volatility, position sizing should remain conservative, with 1%–2% risk per trade and reduced leverage exposure.
Medium-Term Investors
The $70,000–$80,000 range remains a favorable accumulation zone for investors with a multi-month to multi-year horizon. Dollar-cost averaging is preferred, with potential deeper accumulation opportunities near $60,000–$62,000.
Long-Term Holders
Long-term Bitcoin structure remains intact despite cyclical volatility. Historically, post-peak consolidation phases are normal within broader adoption cycles.
The potential long-term accumulation zone remains between $45,000–$50,000, although realization of this scenario depends heavily on macro liquidity conditions and global risk sentiment.
Market Outlook: Balanced Structure
Bullish Drivers
Continued institutional adoption
ETF market maturation
Long-term scarcity narrative
Resilience after geopolitical shocks
Bearish Drivers
Sticky inflation environment
High interest rates
Weak liquidity conditions
Lack of strong directional conviction in derivatives market
Bitcoin currently sits at a critical equilibrium phase around $77,000, where neither bulls nor bears have full control. The market is tightly compressed between $72,000 support and $80,000 resistance, and a breakout from this range will likely define the next major directional cycle.
Until then, Bitcoin is expected to remain range-bound with elevated volatility, heavily influenced by macroeconomic data, Federal Reserve policy expectations, and geopolitical developments.
Long-term structure remains constructive, but short-term caution is necessary.
@Gate_Square @Gate广场_Official
#TradfiTradingChallenge
.
#BTC
Bitcoin is currently trading around $77,000–$78,000, holding a relatively stable structure after months of high volatility and macro-driven swings. The asset has formed a clear consolidation range between $76,000 and $80,000, reflecting equilibrium between buyers accumulating at lower levels and sellers defending higher resistance zones.
The $80,000 level remains a critical psychological and technical barrier. A decisive breakout above this zone could signal renewed bullish expansion, while failure to reclaim it may extend the ongoing consolidation phase. On the downside, Bitcoin continues to maintain structural strength above the $72,000–$74,000 support zone, which has repeatedly acted as a demand area during recent corrections.
Despite this stabilization, BTC still trades significantly below its all-time high near $126,000 (October 2025), highlighting that the broader cycle has transitioned from expansion into distribution and consolidation.
Price Forecast and Technical Analysis
Key Support and Resistance Structure
Bitcoin’s technical landscape is currently well-defined:
Immediate Support: $72,000–$74,000
Major Structural Support: $70,000–$72,000 (aligned with 200-week EMA)
Critical Breakdown Zone: Below $70,000 opens risk toward $60,000–$62,000
Primary Resistance: $80,000
Extended Resistance: $85,000–$88,000
Macro Resistance Zone: $92,000–$95,000
The 200-week exponential moving average continues to act as a historically significant cycle indicator, often marking long-term accumulation zones during deep corrections.
Bullish Scenario
A sustained breakout above $80,000 would likely trigger momentum-driven continuation toward $85,000 initially, followed by extended targets in the $92,000–$95,000 region. If macro liquidity conditions improve and institutional inflows strengthen, Bitcoin could revisit broader upside projections toward $100,000+ levels, with some long-cycle models extending toward $150,000–$250,000 based on adoption-driven valuation expansion.
ETF-related demand and long-term accumulation behavior remain key drivers behind this bullish structure.
Bearish Scenario
If Bitcoin fails to hold $72,000 support, downside pressure could accelerate toward $70,000, followed by deeper retracement zones at $60,000–$62,000. In a more severe macro contraction scenario, analysts highlight a potential long-term cycle floor in the $45,000–$50,000 range, based on historical correction patterns of 40–50% following major cycle peaks.
Such a move would typically coincide with risk-off liquidity conditions and sustained monetary tightening.
Geopolitical Impact on Bitcoin (US–Iran Tensions)
Global geopolitical uncertainty, particularly US–Iran tensions, has added volatility to risk assets. During the initial escalation phase, Bitcoin briefly declined toward $63,000, reflecting panic-driven liquidation and risk-off positioning across global markets.
However, the recovery back above $75,000 demonstrates strong underlying demand and resilience, suggesting that institutional and long-term holders are absorbing sell pressure rather than exiting positions aggressively.
Historically, Bitcoin has shown mixed but often temporary reactions to geopolitical shocks, with price action stabilizing once initial uncertainty fades.
Oil Prices and Inflation Link
Oil prices above $100 per barrel have intensified inflation concerns globally. A key macro relationship suggests that every $10 increase in crude oil can add approximately 0.20% to CPI inflation, directly influencing Federal Reserve policy expectations.
If geopolitical tensions persist and energy prices remain elevated, inflation could remain sticky, forcing central banks to maintain restrictive monetary policy for longer. This scenario typically reduces liquidity availability for risk-on assets like Bitcoin.
CPI Data and Federal Reserve Policy Outlook
Inflation Environment
Recent macro data indicates persistent inflation pressure:
CPI: 3.8% YoY
Core CPI: 2.8%
PPI: Strong monthly surge indicating cost-side inflation persistence
Meanwhile, U.S. Treasury yields have risen sharply, with the 10-year note reaching 4.59%, reflecting tighter financial conditions across markets.
Interest Rate Expectations
Market expectations for near-term rate cuts have significantly declined. A June cut is now nearly off the table, with expectations pushed toward late Q3 or Q4 2026.
Some macro analysts even suggest the possibility of additional rate hikes if inflation remains elevated. This environment is typically unfavorable for Bitcoin in the short term, as higher yields increase the opportunity cost of holding non-yielding assets.
Institutional Positioning and Market Sentiment
Options Market Behavior
The derivatives market reflects a cautious institutional stance. While there is strong call interest around the $80,000 strike, indicating upside speculation, there is also consistent demand for protective puts.
This dual positioning highlights a hedged institutional environment, where participants remain exposed to upside but actively protect against downside risk. The overall structure suggests neutral-to-cautious sentiment rather than aggressive bullish conviction.
ETF Flow Dynamics
Bitcoin ETF flows have shown early stabilization after prior periods of net outflows. However, inflows remain inconsistent, reflecting hesitation among large investors due to macro uncertainty and geopolitical risk.
Despite this, the stabilization itself is an important signal that large-scale distribution pressure may be easing.
Trading Strategy Recommendations
Short-Term Traders
Short-term traders should focus on clearly defined levels:
Buy zone: $72,000–$74,000
Breakout trigger: Above $80,000
Risk management: Tight stops below local swing lows
Due to macro volatility, position sizing should remain conservative, with 1%–2% risk per trade and reduced leverage exposure.
Medium-Term Investors
The $70,000–$80,000 range remains a favorable accumulation zone for investors with a multi-month to multi-year horizon. Dollar-cost averaging is preferred, with potential deeper accumulation opportunities near $60,000–$62,000.
Long-Term Holders
Long-term Bitcoin structure remains intact despite cyclical volatility. Historically, post-peak consolidation phases are normal within broader adoption cycles.
The potential long-term accumulation zone remains between $45,000–$50,000, although realization of this scenario depends heavily on macro liquidity conditions and global risk sentiment.
Market Outlook: Balanced Structure
Bullish Drivers
Continued institutional adoption
ETF market maturation
Long-term scarcity narrative
Resilience after geopolitical shocks
Bearish Drivers
Sticky inflation environment
High interest rates
Weak liquidity conditions
Lack of strong directional conviction in derivatives market
Bitcoin currently sits at a critical equilibrium phase around $77,000, where neither bulls nor bears have full control. The market is tightly compressed between $72,000 support and $80,000 resistance, and a breakout from this range will likely define the next major directional cycle.
Until then, Bitcoin is expected to remain range-bound with elevated volatility, heavily influenced by macroeconomic data, Federal Reserve policy expectations, and geopolitical developments.
Long-term structure remains constructive, but short-term caution is necessary.
@Gate_Square @Gate广场_Official
#TradfiTradingChallenge
.